- Looker
- Articles & Information
- Technical Tips & Tricks
- How to Optimize SQL with EXPLAIN
- Subscribe to RSS Feed
- Mark as New
- Mark as Read
- Bookmark
- Subscribe
- Printer Friendly Page
- Report Inappropriate Content
- Article History
- Subscribe to RSS Feed
- Mark as New
- Mark as Read
- Bookmark
- Subscribe
- Printer Friendly Page
- Report Inappropriate Content
Looker will not be updating this content, nor guarantees that everything is up-to-date.
This article discusses the EXPLAIN command, which is not supported by all database dialects. Be sure to check the Feature Support section in the Looker Database Configuration Instructions specific to your database to confirm whether this function is supported by your database dialect.
Very slow SQL queries are sometimes a fact of life for a database. The database could be running as fast as it can while those queries are transforming a lot of data, or the database could be performing certain tasks that are hard for SQL query planners to accomplish. However, sometimes it's possible to optimize these queries by looking at the steps involved in completing the query, and using this information to redesign the query to be faster. In many SQL dialects, this can be achieved by using the EXPLAIN command.
This article gives a very brief introduction to and an example of how to interpret the results of the EXPLAIN command in SQL Runner. Since every database dialect has a slightly different implementation of EXPLAIN, different dialects often return different information in different formats. Make sure to reference the documentation for your database to find out how to interpret query plans for your dialect.
Example
Here is an example of using the results from an EXPLAIN to optimize a query in MySQL. Suppose we have a persistent derived table that we are using to generate company facts for each company in the database. The LookML and SQL used to generate the derived table looks like this:
Note: permalink here is used as an ID for each company or person. It's only unique in companies.
view: company_facts {
  derived_table: {
    persist_for: "24 hours"
    # This derived table is built in MySQL
    sql: SELECT
        companies.permalink AS permalink,
        companies.name AS name,
        acquisition_by.acquisition_count AS acquisition_count,
        acquired.acquired AS acquired,
        acquired.price_amount AS acquisition_price,
        COUNT(DISTINCT investments.investor_permalink) AS investor_count,
        COUNT(DISTINCT investments.funding_id) AS lifetime_funding_rounds,
        SUM(funding.raised_amount) AS lifetime_funding_raised,

        -- List of all investors, whether they were a person or a company
        GROUP_CONCAT(
        (CASE
          WHEN investor_people.investor_name IS NOT NULL THEN investor_people.investor_name
          WHEN investor_people.investor_name IS NULL THEN investor_companies.name
        END) SEPARATOR ", ") AS investor_name
      FROM companies

      LEFT JOIN funding
      ON companies.permalink = funding.permalink

      LEFT JOIN investments
      ON funding.id = investments.funding_id

      LEFT JOIN (
        SELECT
          people.permalink AS permalink,
          CONCAT(people.first_name, ' ', people.last_name) AS investor_name
        FROM people) AS investor_people
      ON investments.investor_permalink = investor_people.permalink

      LEFT JOIN companies AS investor_companies
      ON investments.investor_permalink = investor_companies.permalink

      -- Calculate the number of acquisitions made by each company
      -- Join into main query
      LEFT JOIN (
        SELECT
          acquisitions.acquired_by_permalink,
          acquisitions.price_amount,
          COUNT(*) AS acquisition_count
        FROM acquisitions
        GROUP BY acquisitions.acquired_by_permalink) AS acquisition_by
      ON companies.permalink = acquisition_by.acquired_by_permalink

      -- Calculate the number of times a company was acquired (should only ever be equal to or less than 1)
      -- Join into main query
      LEFT JOIN (
        SELECT
          acquisitions.acquired_permalink,
          acquisitions.price_amount,
          COUNT(*) AS acquired
        FROM acquisitions
        GROUP BY acquisitions.acquired_permalink) AS acquired
      ON companies.permalink = acquired.acquired_permalink

      GROUP BY companies.permalink
        ;;
  }
}
We have generated a model for this table, joined it on companies, and tested it out in an Explore. What we expected to be a short-running query, never finished, even after waiting 30 minutes.
-- use existing company_facts in crunchtrain_scratch.LR$DB1LLHE8FN9VSAQYNZMIC_company_facts
SELECT
  companies.name AS `companies.name`,
  company_facts.acquisition_count AS `company_facts.lifetime_acquisitions`,
  company_facts.lifetime_funding_raised AS `company_facts.lifetime_funding_raised`,
  company_facts.lifetime_funding_rounds AS `company_facts.lifetime_funding_rounds`
FROM companies
LEFT JOIN crunchtrain_scratch.LR$DB1LLHE8FN9VSAQYNZMIC_company_facts AS company_facts ON companies.permalink = company_facts.permalink

GROUP BY 1,2,3,4
ORDER BY companies.name
LIMIT 500
No one wants to have to wait that long for a query, so let's try to improve this.
We'll run an EXPLAIN on this query and figure out what is going on.
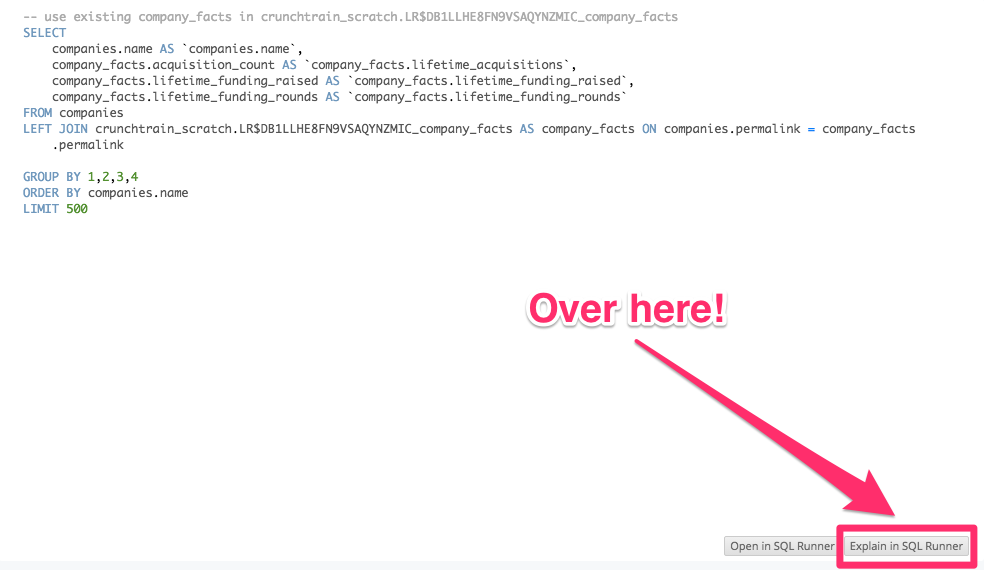
Looker provides a very convenient Explain in SQL Runner button under the SQL tab in the Explore.

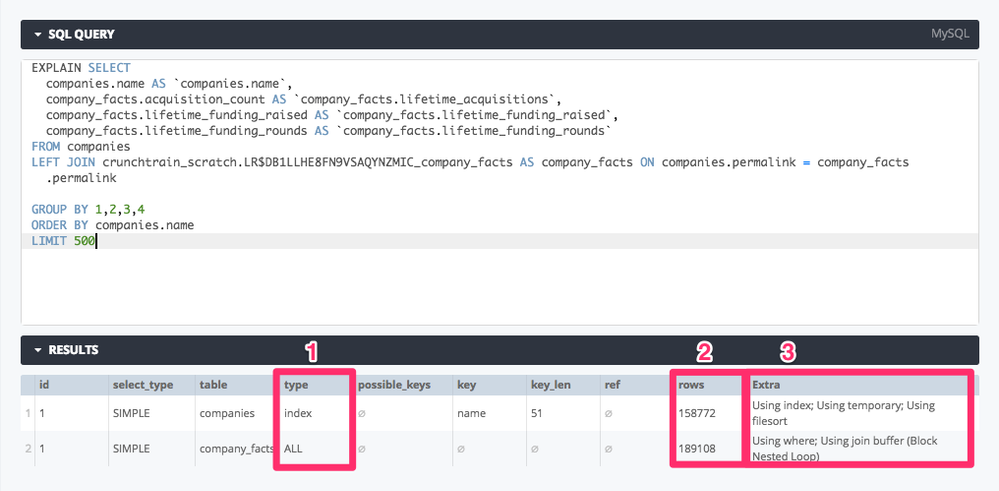
When we click that button, the query is loaded into SQL Runner inside an EXPLAIN function. Once we click on Run in the SQL Runner window, Looker displays a short query plan with some key pieces of information:

The Important Bits
- The type column tells us what kind of table scan was done on that step. The key difference in the results is between
ALLandindex. This tell us that the database is using an index scan to find the rows we care about incompanies, but it's doing a full table scan figuring out what we need out ofcompany_facts, our PDT. - The rows column tells us how many rows were generated in this step and passed along to the next step as an intermediary result. The key thing to look for here is "throw away" rows, which are rows that were generated in one step and then ignored in the next step.
- The Extra column tells us a little bit about other special conditions that might be at work here. In this case, we see that the table scan on
companiesused an index and was sorted, but the scan oncompany_factsdid not. We also see that a nested loop was used to join this table tocompanies.
From this information, I've surmised that I'm missing an index on my derived table, which might be why this query is running so slowly. Joining without an index is forcing the query to loop over all the possible combinations companies.permalink and company_facts.permalink.
We can see this because the query planner told us it was using a nested loop in the Extra column. Since each step in the query planner takes up 158,772 and 189,108 rows respectively, that means that the database has to compare 158,772 * 189,108 = 30,025,055,376 possible matches. No wonder it never finished!
How to Fix It
Luckily, this is a pretty easy problem to get past. We just need to add an index to my derived table. I can do that like this:
view: company_facts {
  derived_table: {
    indexes: ["permalink"]
    persist_for: "1 minute"
    sql: SELECT
      etc...
        ;;
  }
}
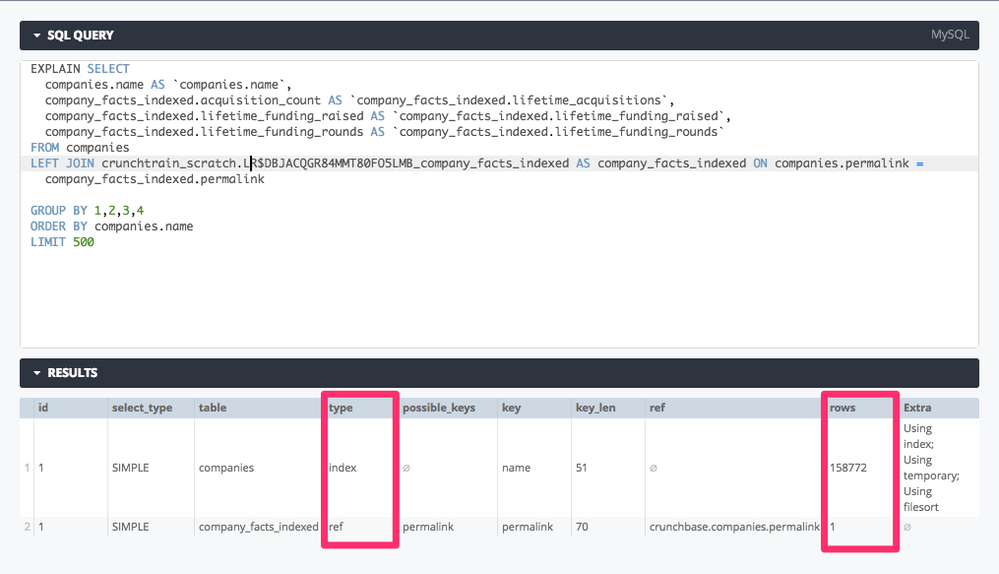
Once I do that, I can refresh my Explore, rebuild the derived table, and run it again:

Wow. 500 rows in 2.2 seconds? That's a huge jump in efficiency! What changed?

As expected, the company_facts step in the query plan has changed and no longer says ALL under type, which means we've eliminated the full table scan. But the most important change is in the rows column, where we see that the value for company_facts has dropped from 189,108 to 1. This means, for each value of permalink, only 158,772 * 1 = 158,772 comparisons need to be performed, which is over 189,108 fewer comparisons total.
Since this is the only really major operation in this query, just adding an index to my PDT made this query faster by a factor of about 189,000.
Other Resources
There are great resources that can guide you through interpreting and using EXPLAIN results. These general resources about using EXPLAIN for SQL are typically dialect-specific.
Here are a few that are very helpful:
- Oracle's Database Performance Tuning Guide
- Severalnines' Using Explain to improve SQL Queries (focuses on MySQL)
- Redshift's EXPLAIN documentation
- The great and very general guide on Use the Index, Luke
Also, consider reading this related Help Center article, Best Practice: Optimize Looker Performance.

 Twitter