- Looker
- Looker Forums
- Modeling
- New LookML breaks cell HTML colour format
- Subscribe to RSS Feed
- Mark Topic as New
- Mark Topic as Read
- Float this Topic for Current User
- Bookmark
- Subscribe
- Mute
- Printer Friendly Page
- Mark as New
- Bookmark
- Subscribe
- Mute
- Subscribe to RSS Feed
- Permalink
- Report Inappropriate Content
- Mark as New
- Bookmark
- Subscribe
- Mute
- Subscribe to RSS Feed
- Permalink
- Report Inappropriate Content
Problem: in 19 days, a Looker upgrade will be performed in my instance, and the HTML/Liquid rendering for heatmap reporting will stop working.
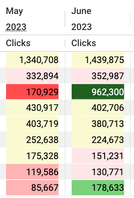
We currently have several dashboards that use HTML and Liquid to colour cells in a table, emulating a heatmap on a column basis.
I am aware of the built in functionality of conditional formatting, but this applies to the entire table, and I need to split the colour coding on each column. This is not what I'm after.
Example, for each row, colour code the lower values with red and the highest value with green.
Result:
See simplified example below from the LookML.
html:
{% assign factor9=mean._value | divided_by: std_dv._value | times: 0.9 %}
...
...
{% if m_std_clc._value > factor9 %}
      <div style="color:white; background-color: rgb(33, 95, 33);">{{ rendered_value }}</div>
....
....
{% else %}
<div style="color:black; background-color: lightgoldenrodyellow;">{{ rendered_value }}</div>
{% endif %} ;;
If I disable the Legacy LookML, the heatmap defaults to `lightgoldenrodyellow`.
How could I fix this before my instance gets upgraded? Thank you
- Labels:
-
Customizing LookML
- Mark as New
- Bookmark
- Subscribe
- Mute
- Subscribe to RSS Feed
- Permalink
- Report Inappropriate Content
- Mark as New
- Bookmark
- Subscribe
- Mute
- Subscribe to RSS Feed
- Permalink
- Report Inappropriate Content
I also need a feature to enable "conditional formatting, which applies to the entire table, and I need to split the colour coding on each column. " featurerequest productmanagement
Rif - Staff Analytics Engineer & Google Developer Expert
-
access grant
6 -
actionhub
1 -
Actions
8 -
Admin
7 -
Analytics Block
27 -
API
25 -
Authentication
2 -
bestpractice
7 -
BigQuery
69 -
blocks
11 -
Bug
60 -
cache
7 -
case
12 -
Certification
2 -
chart
1 -
cohort
5 -
connection
14 -
connection database
4 -
content access
2 -
content-validator
5 -
count
5 -
custom dimension
5 -
custom field
11 -
custom measure
13 -
customdimension
8 -
Customizing LookML
118 -
Dashboards
144 -
Data
7 -
Data Sources
3 -
data tab
1 -
Database
13 -
datagroup
5 -
date-formatting
12 -
dates
16 -
derivedtable
51 -
develop
4 -
development
7 -
dialect
2 -
dimension
46 -
done
9 -
download
5 -
downloading
1 -
drilling
28 -
dynamic
17 -
embed
5 -
Errors
16 -
etl
2 -
explore
58 -
Explores
5 -
extends
17 -
Extensions
9 -
feature-requests
6 -
filter
220 -
formatting
13 -
git
19 -
googlesheets
2 -
graph
1 -
group by
7 -
Hiring
2 -
html
19 -
ide
1 -
imported project
8 -
Integrations
1 -
internal db
2 -
javascript
2 -
join
16 -
json
7 -
label
6 -
link
17 -
links
8 -
liquid
154 -
Looker Studio Pro
1 -
looker_sdk
1 -
LookerStudio
3 -
lookml
859 -
lookml dashboard
20 -
LookML Foundations
54 -
looks
33 -
manage projects
1 -
map
14 -
map_layer
6 -
Marketplace
2 -
measure
22 -
merge
7 -
model
7 -
modeling
26 -
multiple select
2 -
mysql
3 -
nativederivedtable
9 -
ndt
6 -
Optimizing Performance
30 -
parameter
70 -
pdt
35 -
performance
11 -
periodoverperiod
16 -
persistence
2 -
pivot
3 -
postgresql
2 -
Projects
7 -
python
2 -
Query
3 -
quickstart
5 -
ReactJS
1 -
redshift
10 -
release
18 -
rendering
3 -
Reporting
2 -
schedule
5 -
schedule delivery
1 -
sdk
5 -
singlevalue
1 -
snowflake
16 -
sql
222 -
system activity
3 -
table chart
1 -
tablecalcs
53 -
tests
7 -
time
8 -
time zone
4 -
totals
7 -
user access management
3 -
user-attributes
9 -
value_format
5 -
view
24 -
Views
5 -
visualizations
166 -
watch
1 -
webhook
1 -
日本語
3
- « Previous
- Next »

 Twitter
