- Looker
- Looker Forums
- Modeling
- How to determine when Query Performance issues are...
- Subscribe to RSS Feed
- Mark Topic as New
- Mark Topic as Read
- Float this Topic for Current User
- Bookmark
- Subscribe
- Mute
- Printer Friendly Page
- Mark as New
- Bookmark
- Subscribe
- Mute
- Subscribe to RSS Feed
- Permalink
- Report Inappropriate Content
- Mark as New
- Bookmark
- Subscribe
- Mute
- Subscribe to RSS Feed
- Permalink
- Report Inappropriate Content
There are many factors that contribute to slow Query Performance in the Looker application, one of the most common ones is when the source databases (where data is fetched) and/or the connections defined for them in Looker are having problems handling the amount of requests triggered by the users, or simply because the SQL queries just take too long to execute once they reach the source database.
We can use data from System Activity to verify if that is happening for a particular connection, the System Activity Explore called Query Performance Metrics can give us information on what stages from the query lifecycle are having increased runtimes, specially the ones that refer to connection restrictions and SQL query execution times.
Connection Request Bottleneck
The first thing we can check is if the amount of requests for a specific connection is hitting the threshold for number of active connections, we can use the following URL as a base:
- https://<instance_domain>/explore/system__activity/query_metrics?fields=history.created_date,query_metrics.acquire_connection_average,query_metrics.count_acquire_connection&fill_fields=history.created_date&f[history.created_date]=7+days&f[history.connection_name]=<connection_name>&sorts=history.created_date+desc&limit=500&column_limit=50&toggle=dat,pik,vis
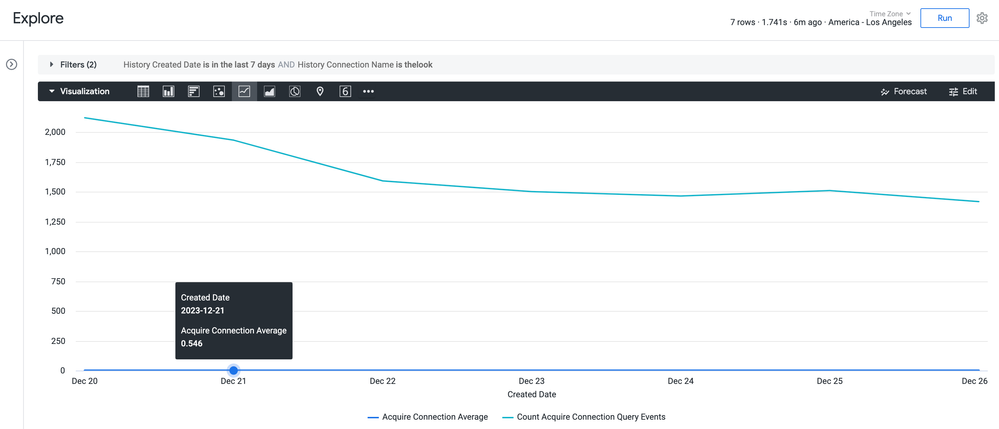
Which will show a graph similar to this:
As we see on the graph, we have a big count of Acquire Connection Query Events, which means that for that connection we are surpassing the limit on simultaneous queries we can run at a time very frequently, this means that for some users, their queries may appear slower as their queries have to wait for other queries to complete before they can be executed.
The Acquire Connection Average value can give us an estimate on how much time the queries have to wait (queued) before a connection is available for their execution, in this case, the value is less than a second, so, depending on the use case, it may be a value we can work with, however, if we want to remove any additional runtime related to this we will have to change/test with the settings on the Looker application, including the specific connection and the source database limit configuration.
The settings that we can change in the Looker connection related to this are the following (note that this will depend entirely on the database resources you have and the modeling you use, the Looker Support team will not be able to guide you thoroughly on this or make specific value recommendations for these connection fields):
- Max connections per node: Default accepted values are between 5 - 100 connections, this value should also be set according to the connection limit value on your source database (equal or lower).
- Connection Pool Timeout: If we surpass the connections request limit listed for the Max connections per node field at some point, any additional requests will have to wait until other connections are free to be used, this setting allows you to control how much time those additional requests can wait for an available connection before being cancelled.
We can also override the maximum value that can be used for the Max connections per node field (100 by default), this needs to be done at the application level using the max-configurable-db-connections startup option (if your instance is Looker-hosted, you'll need to reach out to Looker Support for next steps, do note the information at the end of this post for this).
Per-User Query Limit/Timeout
Looker also restricts the amount of concurrent queries a user can trigger for a specific connection, this is done to avoid situations were a sole user takes all the available connections which would block other users from executing their own until free connections are available once again.
The default values for this restriction are: 15 concurrent queries per user and a timeout of 600 seconds for queued queries due to this limit.
We can also verify if this is happening on the instance, we can use this other URL as a base:
- https://<instance_domain>/explore/system__activity/query_metrics?fields=history.created_date,query_metrics.per_user_throttler_average,query_metrics.count_per_user_throttler_events&fill_fields=history.created_date&f[history.connection_name]=<connection_name>&f[history.created_date]=7+days&sorts=history.created_date+desc&limit=500&column_limit=50&toggle=dat,pik,vis
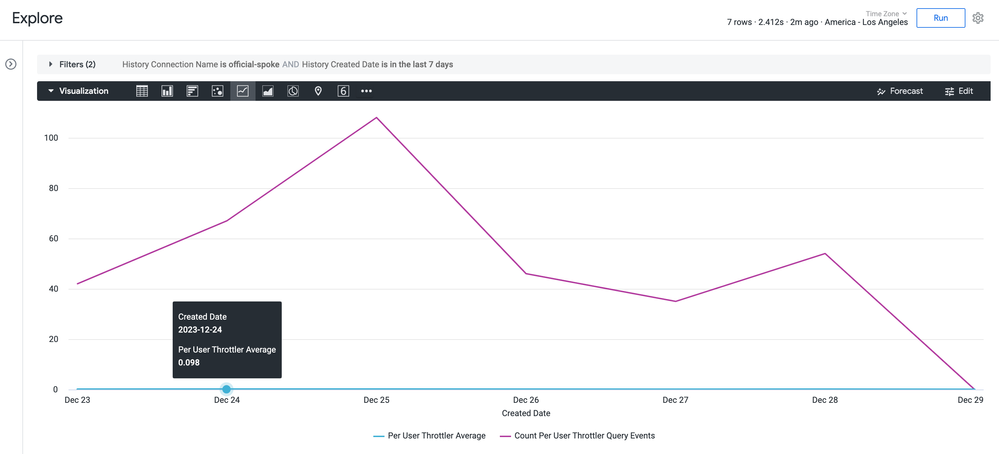
We could see something similar to this:
This graph shows that we are indeed hitting the Per-User limit (count of Per User Throttler Query Events) multiple times, which is causing some of the queries to be queued due to that, the users that triggered the queries flagged by the "throttler" may experience increased runtimes on some of their queries until their concurrent query count goes down and new requests can be picked up by Looker.
This is a restriction on the Looker application to protect the application and the source databases from being overwhelmed by high amounts of user requests, the Per User Throttler Average can give us an estimate on how much time queries are queued up due to this limit before being picked up once again (concurrent query count of the user goes down), in this case the value is less than a second, so it may be something that we can ignore, but there are cases where a major refactor of Looker content/LookML will be the only next step available.
One of the main causes of issues related to this are Dashboards that do not follow best practices and have more than 25 query tiles as listed in our documentation: https://cloud.google.com/looker/docs/best-practices/considerations-when-building-performant-dashboar..., if a Dashboard is too big and many users try to trigger the queries related to it, they will take away all the available connections first, then queries will start to be queued either by the connection or the per-user limit and there will be very visible performance issues due to that, which will have to be dealt with on the customer side.
There are two startup options linked to the per-user limit that can also be changed (at the application level) to override the default values for both the concurrent query limit and the timeout:
- per-user-query-limit
- per-user-query-timeout
If your instance is Looker-hosted, you'll need to reach out to Looker Support for next steps, do note the information at the end of this post for this.
SQL Execution time
Finally, there could be some changes on the actual execution runtime of the queries once they reach the source database, Looker keeps track of that timing as well, we can use the following URL to see if there are any relevant spikes for it:
- https://<instance_domain>/explore/system__activity/query_metrics?fields=history.completed_date,query_metrics.execute_main_query_average&fill_fields=history.completed_date&f[history.connection_name]=<connection_name>&f[history.completed_date]=7+days&sorts=history.completed_date+desc&limit=500&column_limit=50&toggle=dat,pik,vis
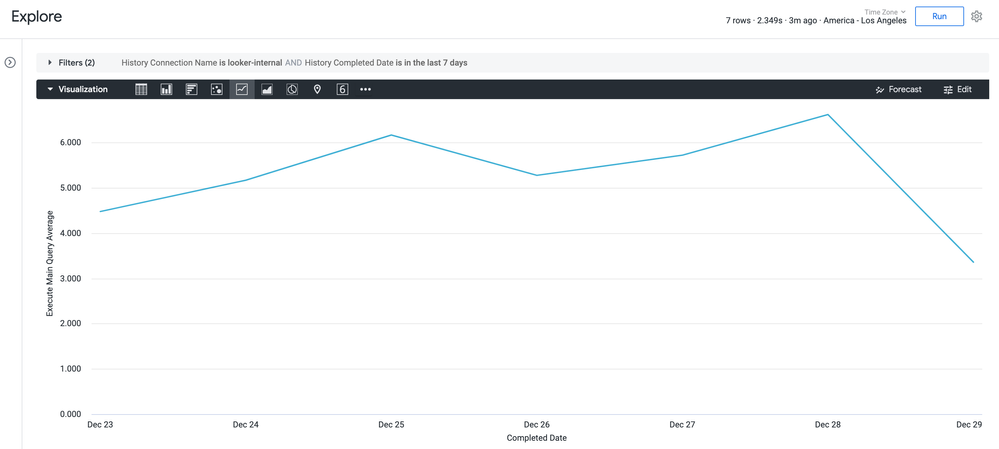
Something like this may be shown:
If sudden spikes are seen in this graph, it may indicate that your database is having problems either with the amount of requests or the complexity of the queries that are being sent from Looker, it is recommended that we review the resource metrics on the database to see if there is a problem in that aspect (and that you must rectify), networking issues can also impact the runtime (not very common, but it can happen if something is changed on the database side) so you could also review that just in case.
Of course not all SQL execution runtime problems are related solely on the database, there could be some taxing content (Dashboard, Look, etc.) with complex queries that may be impacting the performance on the instance (for which the modeling may have to be reviewed/refactored on your side), or a change in the application/LookML that is now adding more complexity (Liquid, Totals/Subtotals, PDTs, etc.) to the generated SQL queries, to mention a few possibilities, in such cases it is still recommended to gather as much information as possible on database resources and recent changes on your content/code before reaching out to the Looker Support team, to help expedite resolution.
Out of Scope
As you see listed on this post, there are many external aspects that are linked to issues for Query Performance, many of them can be mitigated by changing/testing some Looker settings/startup options, however, neither the Looker DevOps team or the Looker Support team will be able to give guidance or even recommendations to be used on those parts of the application (they can only help you changing/enabling startup options if you are Looker-hosted), both the instance(s) and the source database(s) could be overwhelmed if wrong values were to be used.
Only your team can provide the values to be used for such cases, as you are the ones that know your infrastructure and Looker content/code/users better, if you want assistance for that, our Looker Professional Services team would be the only next step that Looker can offer, if you want to explore that path you will need to reach out to your Account Team so they can explain next steps and clarify any other question you may have about it.
The Looker Support team will not be able to help you with major refactors of LookML or content (Dashboards, Looks, etc.) that may be needed to improve query performance either, that is out of scope for that team, the Looker Professional Services team may be able to offer guidance on that aspect as well, in case you want to explore that option.
Any other infrastructure problems that may be related to Query Performance, like database configuration, networking, On-Prem Looker deployments, etc., is also out of scope for the Looker Support team, they will be very limited on the help/guidance they can offer for that, the same is true for the Looker DevOps team, as they only deal with processes related to Looker-hosted instances.
- Labels:
-
Optimizing Performance
-
access grant
6 -
actionhub
1 -
Actions
8 -
Admin
7 -
Analytics Block
27 -
API
25 -
Authentication
2 -
bestpractice
7 -
BigQuery
69 -
blocks
11 -
Bug
60 -
cache
7 -
case
12 -
Certification
2 -
chart
1 -
cohort
5 -
connection
14 -
connection database
4 -
content access
2 -
content-validator
5 -
count
5 -
custom dimension
5 -
custom field
11 -
custom measure
13 -
customdimension
8 -
Customizing LookML
119 -
Dashboards
144 -
Data
7 -
Data Sources
3 -
data tab
1 -
Database
13 -
datagroup
5 -
date-formatting
12 -
dates
16 -
derivedtable
51 -
develop
4 -
development
7 -
dialect
2 -
dimension
46 -
done
9 -
download
5 -
downloading
1 -
drilling
28 -
dynamic
17 -
embed
5 -
Errors
16 -
etl
2 -
explore
58 -
Explores
5 -
extends
17 -
Extensions
9 -
feature-requests
6 -
filter
220 -
formatting
13 -
git
19 -
googlesheets
2 -
graph
1 -
group by
7 -
Hiring
2 -
html
19 -
ide
1 -
imported project
8 -
Integrations
1 -
internal db
2 -
javascript
2 -
join
16 -
json
7 -
label
6 -
link
17 -
links
8 -
liquid
154 -
Looker Studio Pro
1 -
looker_sdk
1 -
LookerStudio
3 -
lookml
858 -
lookml dashboard
20 -
LookML Foundations
54 -
looks
33 -
manage projects
1 -
map
14 -
map_layer
6 -
Marketplace
2 -
measure
22 -
merge
7 -
model
7 -
modeling
26 -
multiple select
2 -
mysql
3 -
nativederivedtable
9 -
ndt
6 -
Optimizing Performance
30 -
parameter
70 -
pdt
35 -
performance
11 -
periodoverperiod
16 -
persistence
2 -
pivot
3 -
postgresql
2 -
Projects
7 -
python
2 -
Query
3 -
quickstart
5 -
ReactJS
1 -
redshift
10 -
release
18 -
rendering
3 -
Reporting
2 -
schedule
5 -
schedule delivery
1 -
sdk
5 -
singlevalue
1 -
snowflake
16 -
sql
222 -
system activity
3 -
table chart
1 -
tablecalcs
53 -
tests
7 -
time
8 -
time zone
4 -
totals
7 -
user access management
3 -
user-attributes
9 -
value_format
5 -
view
24 -
Views
5 -
visualizations
166 -
watch
1 -
webhook
1 -
日本語
3
- « Previous
- Next »

 Twitter

