- Looker
- Looker Forums
- Administering Looker
- Re: How do Looker calculate average session durati...
- Subscribe to RSS Feed
- Mark Topic as New
- Mark Topic as Read
- Float this Topic for Current User
- Bookmark
- Subscribe
- Mute
- Printer Friendly Page
- Mark as New
- Bookmark
- Subscribe
- Mute
- Subscribe to RSS Feed
- Permalink
- Report Inappropriate Content
- Mark as New
- Bookmark
- Subscribe
- Mute
- Subscribe to RSS Feed
- Permalink
- Report Inappropriate Content
I'd like to understand how this math is done. When I take those data and calculate the average in Excel or PowerBi, the average time duration is: 00:06:18, but in Looker is 00:04:39. Why? Someone, could you please, help me?

- Mark as New
- Bookmark
- Subscribe
- Mute
- Subscribe to RSS Feed
- Permalink
- Report Inappropriate Content
- Mark as New
- Bookmark
- Subscribe
- Mute
- Subscribe to RSS Feed
- Permalink
- Report Inappropriate Content
How are you calculating the average? With a table calculation, a measure, etc?
I'd need a little more context before I can say for sure what's happening.
- Mark as New
- Bookmark
- Subscribe
- Mute
- Subscribe to RSS Feed
- Permalink
- Report Inappropriate Content
- Mark as New
- Bookmark
- Subscribe
- Mute
- Subscribe to RSS Feed
- Permalink
- Report Inappropriate Content
Hi Sam,
Thanks for trying to help me.
I just took those data and put in a excel spreadsheet and select all of them. Automatically the average appear on bottom. Example below.
"Média" means average.
- Mark as New
- Bookmark
- Subscribe
- Mute
- Subscribe to RSS Feed
- Permalink
- Report Inappropriate Content
- Mark as New
- Bookmark
- Subscribe
- Mute
- Subscribe to RSS Feed
- Permalink
- Report Inappropriate Content
I attempted to reproduce this internally, and I got the 6:17 as the average. Not exactly 6:18, but much closer than 4:39.
I must be missing something about your setup. Can you share more details about the field definition? For example, mine is defined like this:
- Mark as New
- Bookmark
- Subscribe
- Mute
- Subscribe to RSS Feed
- Permalink
- Report Inappropriate Content
- Mark as New
- Bookmark
- Subscribe
- Mute
- Subscribe to RSS Feed
- Permalink
- Report Inappropriate Content
Appreciate it, Sam! But the value i'd like to understand is 00:04:39 showed at Looker Studio when they calculate average, you know? What kind of math do i need to do to achieve that result. That's my setup.
Metric configuration:
Classify configuration:
BTW, i've created a table connected to my GA4.
- Mark as New
- Bookmark
- Subscribe
- Mute
- Subscribe to RSS Feed
- Permalink
- Report Inappropriate Content
- Mark as New
- Bookmark
- Subscribe
- Mute
- Subscribe to RSS Feed
- Permalink
- Report Inappropriate Content
That is super helpful! I think your screenshots pinpoint the problem. I think that the issue is the "Running Average" in the "Running Calculation" section of your first screenshot. I think that the grand total average is being applied to the average (not the running average), but the column values show the running average.
In my test, I turned on Running Average and now the numbers are larger:
I calculated the average of the second column's values and it's 00:14:52, not 00:06:17. So here the numbers are misleading.
To test my theory, can you try changing Running Average to None and see if the average is correct then? My guess is that when you do that, all the numbers will get smaller and the average will be correct.
- Mark as New
- Bookmark
- Subscribe
- Mute
- Subscribe to RSS Feed
- Permalink
- Report Inappropriate Content
- Mark as New
- Bookmark
- Subscribe
- Mute
- Subscribe to RSS Feed
- Permalink
- Report Inappropriate Content
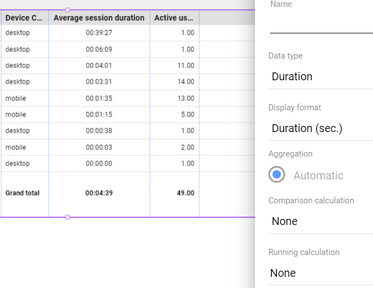
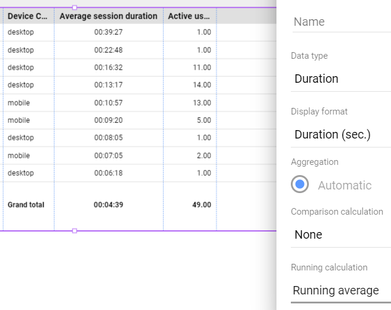
Here we can see a good comparison:
Example 1 - None
Example 2 - Running average
- Mark as New
- Bookmark
- Subscribe
- Mute
- Subscribe to RSS Feed
- Permalink
- Report Inappropriate Content
- Mark as New
- Bookmark
- Subscribe
- Mute
- Subscribe to RSS Feed
- Permalink
- Report Inappropriate Content
Thanks for sharing! It looks like the running average was not the problem.
I'm stumped! It's so strange that when I put those same numbers into a table, I get a grand total of 00:06:17, while you get 00:04:39. I don't see any difference in our setups.
Maybe someone else has seen a similar issue and can chime in with something we may be missing?
- Mark as New
- Bookmark
- Subscribe
- Mute
- Subscribe to RSS Feed
- Permalink
- Report Inappropriate Content
- Mark as New
- Bookmark
- Subscribe
- Mute
- Subscribe to RSS Feed
- Permalink
- Report Inappropriate Content
Thanks for your efforts so far, Sam. Apparently, to clarify this will be harder than I thought. It just makes me think about how accurate those data are (even in GA4).
-
access grant
5 -
actionhub
2 -
Actions
4 -
Admin
32 -
alert
6 -
Analytics
1 -
Analytics Block
14 -
API
10 -
Authentication
13 -
bestpractice
1 -
BigQuery
13 -
blocks
2 -
boards
5 -
Bug
30 -
cache
3 -
Cloud Error Reporting
1 -
Cloud Load Balancing
1 -
connection
20 -
connection database
4 -
content access
4 -
content-validator
2 -
custom field
2 -
custom measure
1 -
Dashboards
27 -
Data
1 -
Data Sources
1 -
Database
13 -
datagroup
1 -
derivedtable
1 -
develop
1 -
development
2 -
done
1 -
download
4 -
downloading
2 -
embed
8 -
Errors
9 -
explore
9 -
Explores
1 -
Extensions
1 -
feature-requests
2 -
filed
1 -
filter
12 -
folders
2 -
formatting
1 -
General Looker Administration
161 -
git
16 -
Google Sheets
1 -
googlesheets
1 -
i__looker
3 -
imported project
1 -
Integrations
1 -
internal db
4 -
liquid
1 -
Looker
5 -
LookerStudio
1 -
lookml
13 -
looks
4 -
manage projects
2 -
Marketplace
2 -
model
1 -
modeling
1 -
mysql
5 -
Networking
3 -
pdf
1 -
pdt
6 -
performance
3 -
permission management
12 -
Projects
3 -
query manager
1 -
redshift
6 -
release
9 -
rendering
1 -
Reporting
1 -
schedule
20 -
schedule delivery
2 -
sdk
2 -
Security
8 -
server configuration
2 -
Setting up your Looker Instance
33 -
sharing
2 -
snowflake
1 -
sql
4 -
SSO
7 -
system activity
8 -
time zone
2 -
Training
2 -
Ui
2 -
usage
5 -
User access & management
46 -
user access management
10 -
user management
8 -
user-attributes
9 -
visualizations
7 -
webhook
3
- « Previous
- Next »

 Twitter


