This website uses Cookies. Click Accept to agree to our website's cookie use as described in our Privacy Policy. Click Preferences to customize your cookie settings.
Turn on suggestions
Auto-suggest helps you quickly narrow down your search results by suggesting possible matches as you type.
Showing results for
- Looker
- Looker Forums
- Exploring & Curating Data
- Time-Series Alerts with Dynamic Thresholds
Topic Options
- Subscribe to RSS Feed
- Mark Topic as New
- Mark Topic as Read
- Float this Topic for Current User
- Bookmark
- Subscribe
- Mute
- Printer Friendly Page
Solved


 LinkedIn
 Twitter
Post Options
- Mark as New
- Bookmark
- Subscribe
- Mute
- Subscribe to RSS Feed
- Permalink
- Report Inappropriate Content
Reply posted on
--/--/---- --:-- AM
Post Options
- Mark as New
- Bookmark
- Subscribe
- Mute
- Subscribe to RSS Feed
- Permalink
- Report Inappropriate Content

This is a cross-post from our blog.
Looker 6.24 introduced conditional alerting for dashboard content. The new feature fills a much-need gap beyond the standard scope of “scheduled looks”, but at first glance appears limited to static threshold alerting. Here we demonstrate how one can leverage the feature’s underlying flexibility to create advanced alerts with self-adaptive thresholds.
Some examples of how this dynamic alerting can be used include:
- Identify bugs and achieve faster incident response times with dynamic thresholds around hourly volume in different areas of a system (website traffic, order creations, etc.) .
- Recognizing demand spikes for resource allocation (call center, order fulfillment, etc.)
- Warning thresholds before breaching critical SLAs (inquiry response times, order fulfillment delay, etc.)
- Suspicious behavior/fraud detection (charge attempts, geospatial platform activity, etc.)
We’ll first walk through a description of the Look and alerting behavior before diving into the specific implementation steps.
Pre-read: Documentation
Before starting, it might be worth skimming Looker’s current documentation around the feature.
The Look — Creating A Dynamic Threshold
The following Look monitors a measurement throughout the day. Let’s say it measures some arbitrary widget’s traffic volume.
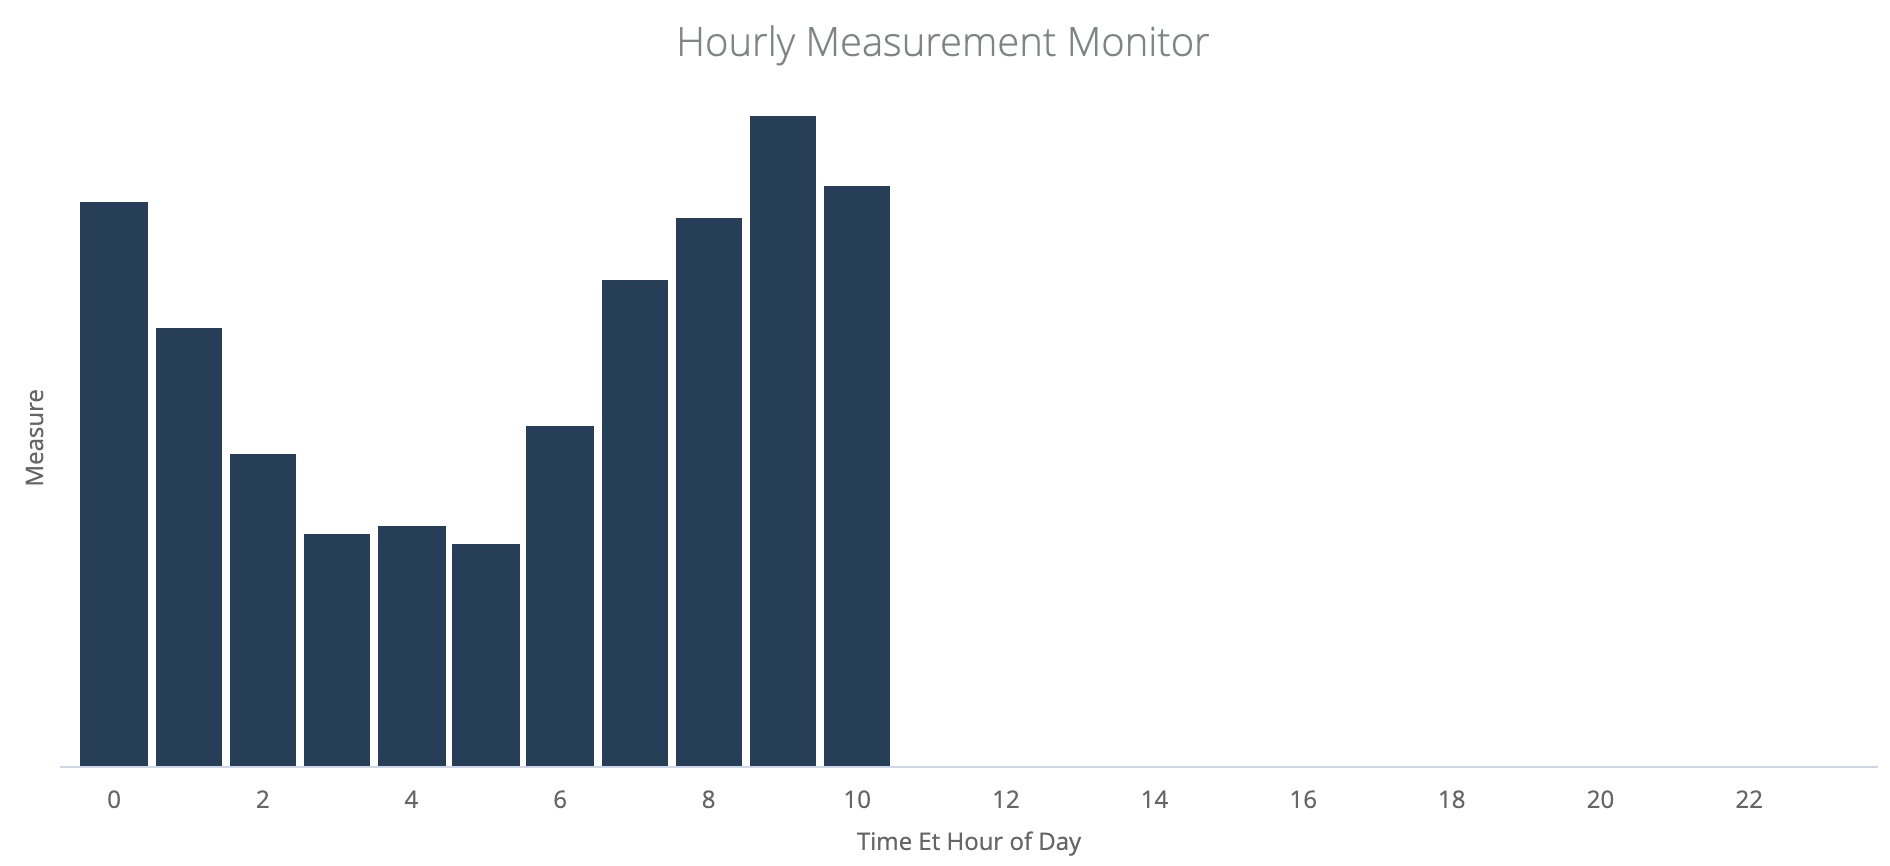
Hourly widget volume for current day
The above chart does not tell us much because we don’t have anything to compare today’s volume against. We can add in the average hourly volume over the past 4 weeks for a benchmark comparison. If the current day is Thursday, for example, the volumes for the last four Thursdays are to be used.
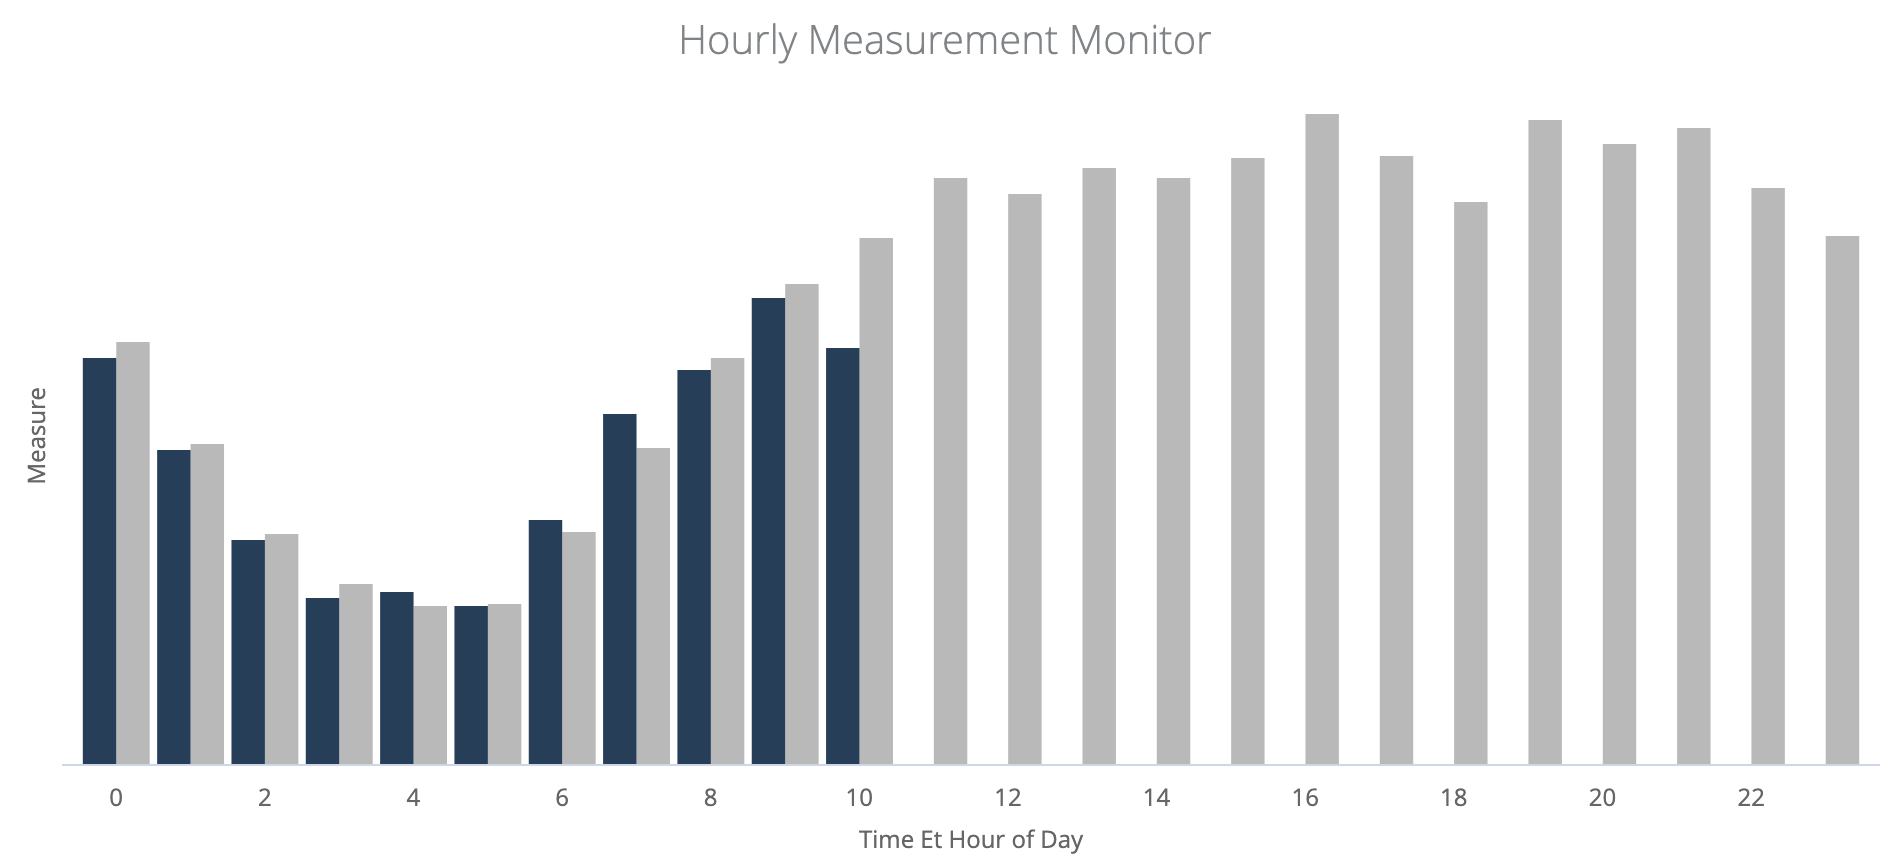
Hourly widget volume along with the 4-week average
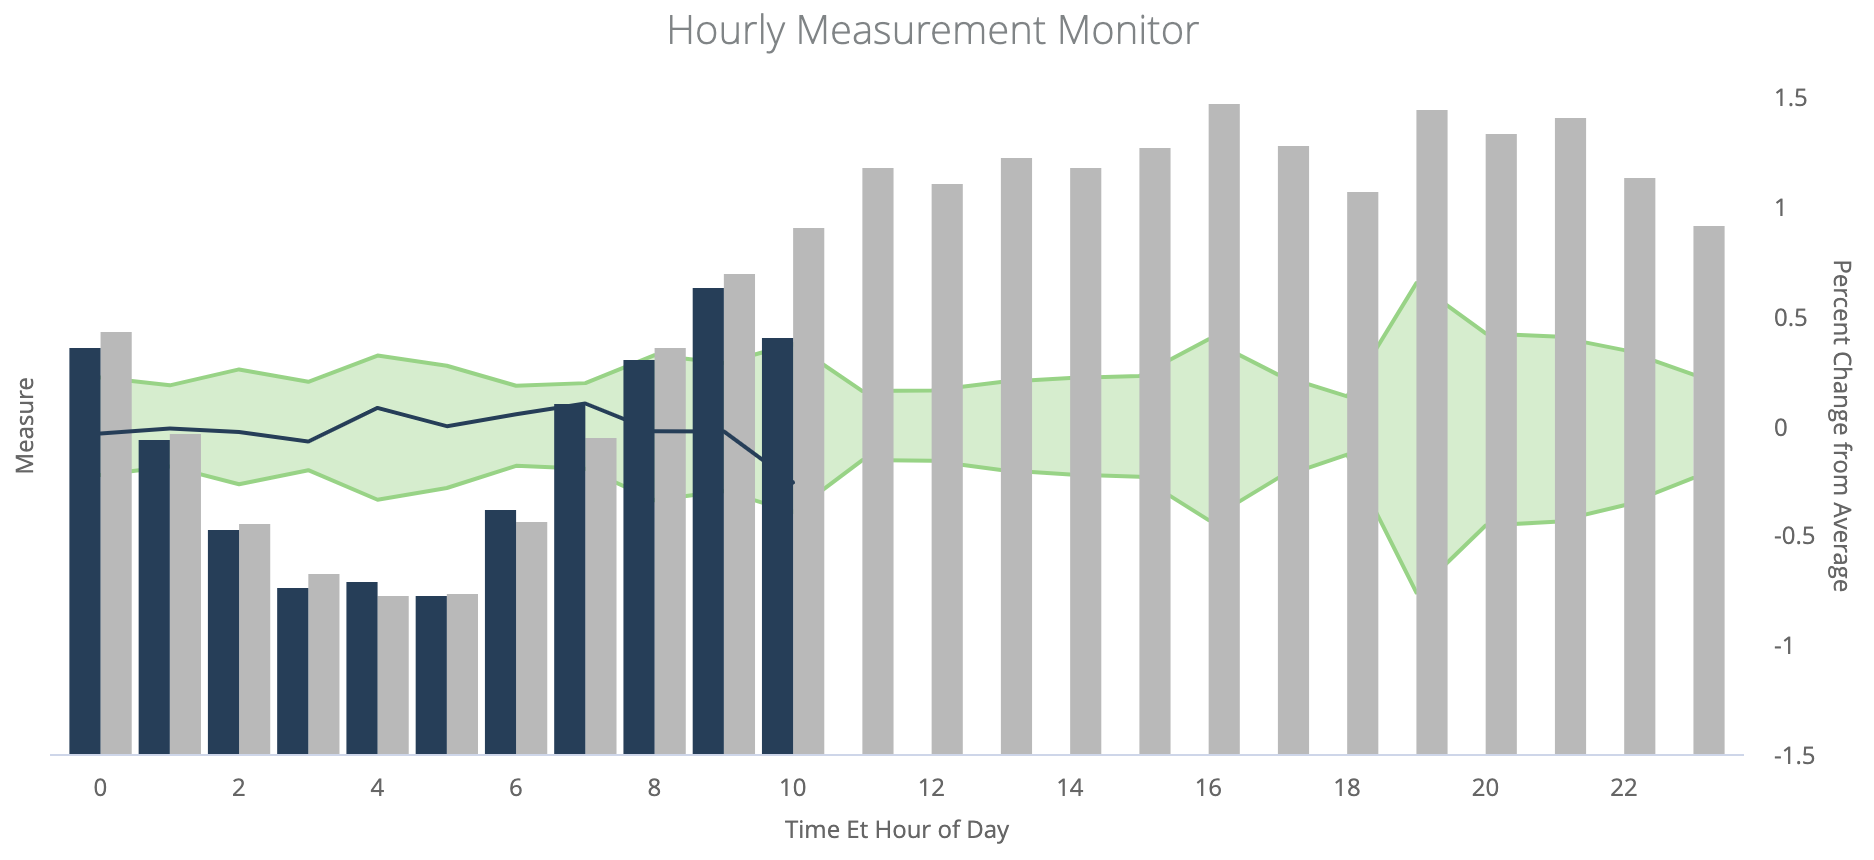
We now have our measure plotted with hourly granularity along with the historical average for comparison. It is often useful to compare the relative change, as opposed to absolute, which is why we introduce the third data-series for percent-change of each week’s volume relative to the 4-week average. This third series is plotted on the right axis below.

Hourly widget volume vs 4 week average, including percent change relative to the average
The blue series represents the current day’s percent change from the average. It would be unreasonable to manually check the volume at each hour throughout the day. Nor would it be very scalable once you have multiple widgets to monitor. We can easily scale our monitoring by setting an hourly alert that notifies of any new deviance.
But how would we decide what threshold would be reasonable to alert on? Would this threshold change based on widget, hour, and day? Should it also adapt to weekly trending volume? All of these can be accomplished with a dynamic self-adjusting threshold.
The threshold is defined using our sample of relative volume changes over the past few weeks. Using the average and variance of percent-change, the threshold can self-adjust throughout the day in periods of higher volume and/or variability.

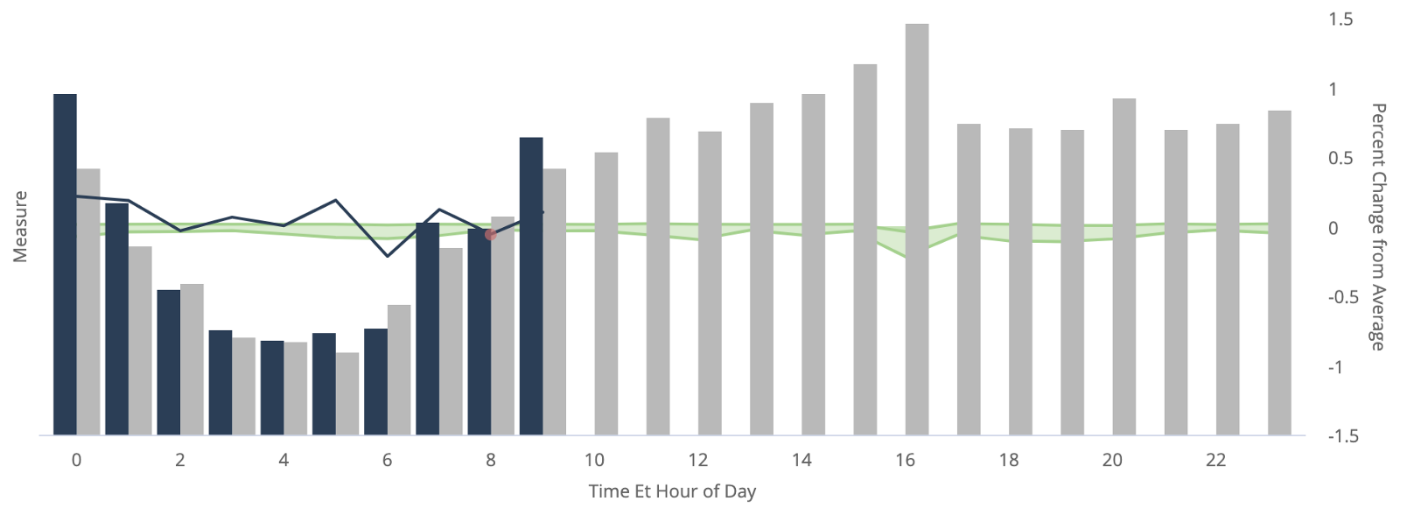
Hourly widget volume vs 4 week average, including percent change relative to the average with a dynamic threshold
The green shaded region above defines the range of acceptable deviation, which is simply the average percent-change for that hour +/- three standard deviations. Any actuals that are outside of the acceptable range (historical_average +/- acceptable_deviation) are cause for concern.
It is easier on the eyes to hid the historical percent-change series (see grey lines) since they are are only needed for the threshold calculation. Once hidden, we are left with a chart showing the current day’s volume, historical average, current day’s relative change, and the range of acceptable deviation for that change.
Final dashboard visualization monitoring hourly widget volume
The Alert — No Repeat Alerts
Our goal here is to set an alert based on these dynamic conditions to notify us of any significant changes as they occur. Most alerts are moving targets. We don’t want to be alerted about one single dip at 10 AM, and then reminded again at 11 AM, 12 PM, 1 PM, and up until midnight. The alert should grab our attention once, and we should only hear from it again if a new deviation occurs.
For this reason, we can customize the alert to act as a sliding window throughout the day. It should only focus on the most recent complete hour to avoid false-positives caused by incomplete intervals. This depends on the underlying data’s recency and synch frequency. For example, we can target the alert on every { t -2} hour. If the system time just hit 14:00, for example, then the alert will focus on 12:00.
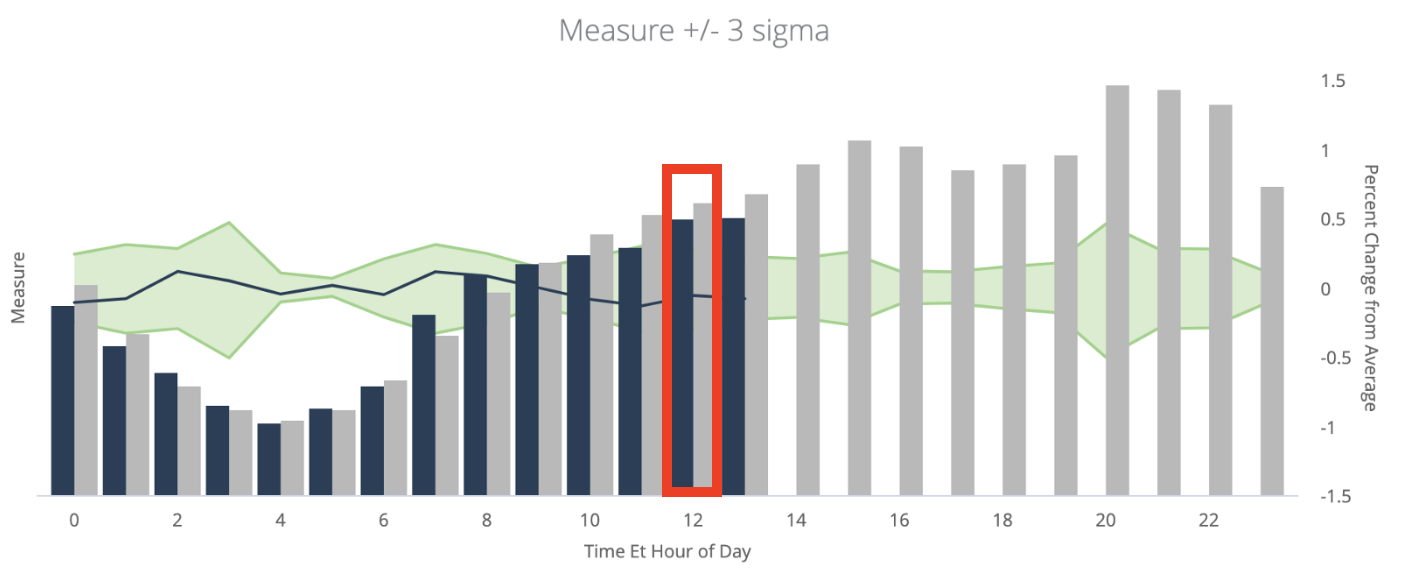
Right now the green region is set to a conservative (+/-) 3 standard deviations around the average. Once tightened to (+/-) 0.5 standard deviations, we see that the observed volume 2 hours ago moved outside of the green region as denoted by the red dot.
For the sake of being over-dramatic, we would need to set (7 X 24) 168 different thresholds for each widget at the start of each week due to the varying hourly, widget, and weekly trending volumes. Instead, all we do is set one constant in the threshold equation derived from historical averages and variance.
Step-by-Step Implementation Instructions
And now for the details. There are quite a few components to having the above alert run with absolutely no maintenance overhead.
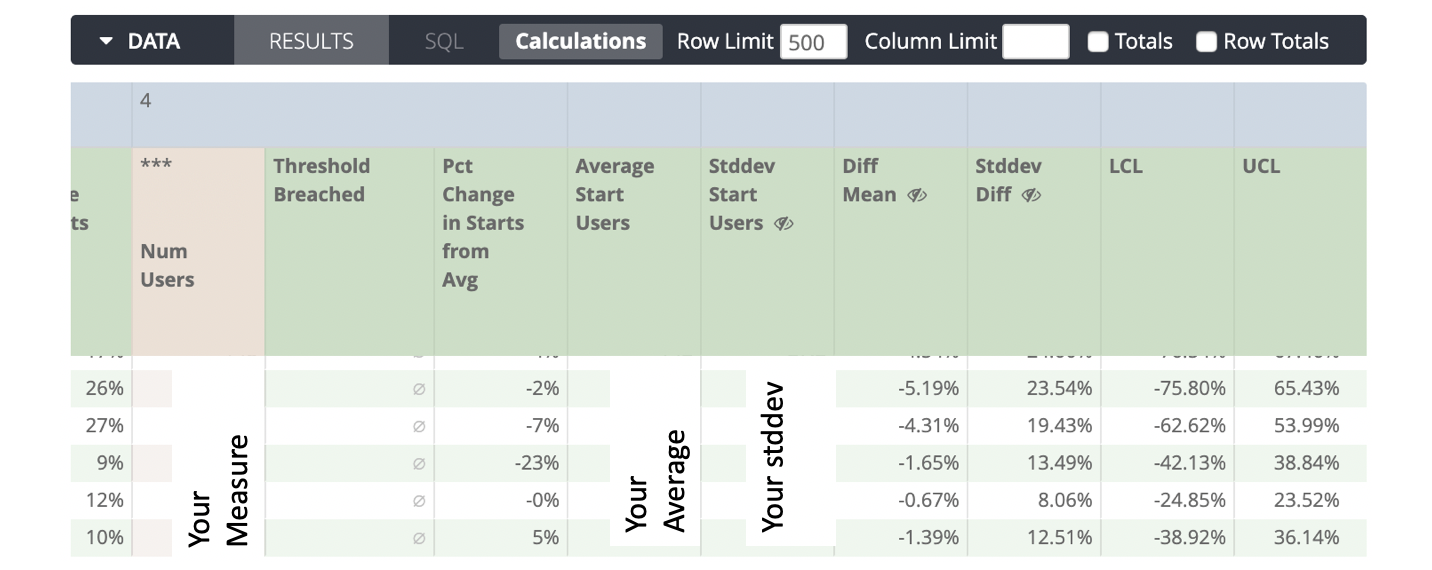
Preview of result table
Here is what the result table looks like in the upper left and lower right hand sides:

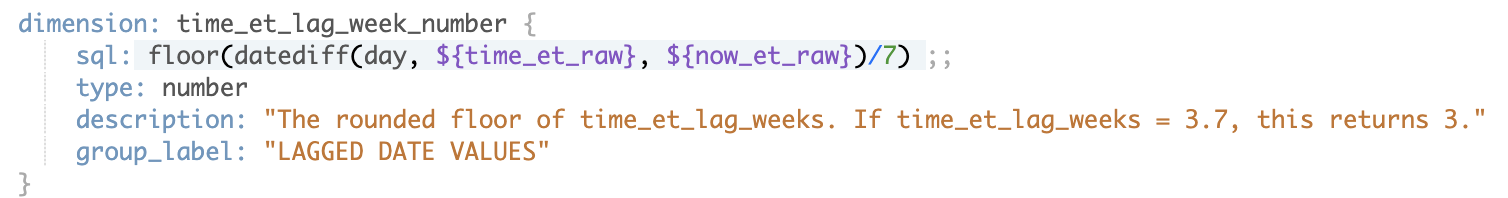
Lagged time dimensions
You’ll notice the pivoted columns are integers instead of dates. This is to prevent us from reworking all of the following steps each week when the pivoted column names change to new dates. This dimension keeps the pivoted column names constant week-over-week. Timezone conversion in Looker can be dicey, so it’s easier to use raw variables from the same timezone.
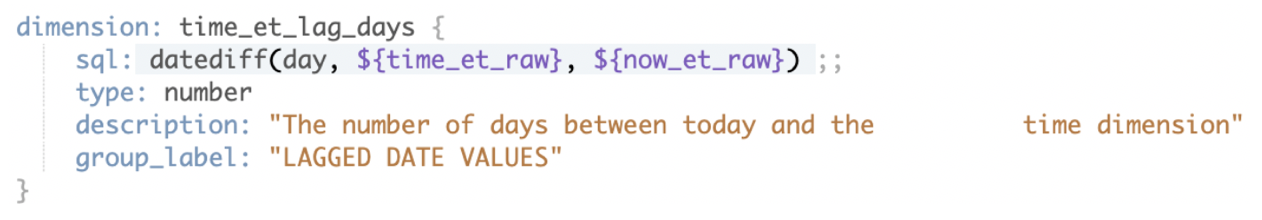
Using hour_of_day volume on a daily basis can be problematic whenever the underlying data’s recency is delayed. If the alert is running on a two hour lag, then we need to direct the 1 AM run to 11 PM the prior night. Using a custom filter like the below in conjunction with another lagged date variable solves that problem.

Percent change from average
Calculating the percent change is fairly straightforward. The notation is simplified by including the current day’s number in the average calculation, so this isn’t a pure historical average.
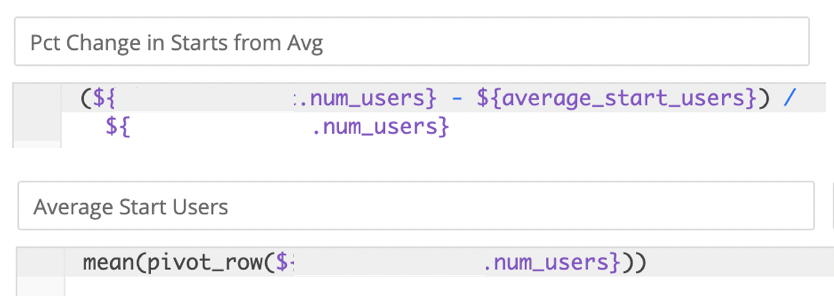
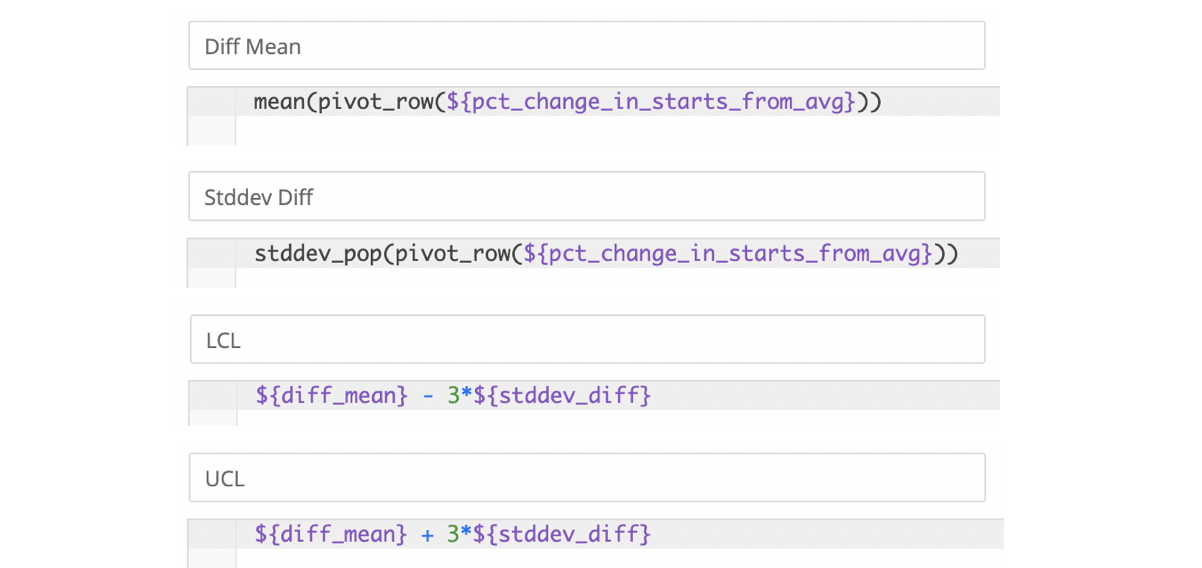
Mean, standard deviation, and control limits
Since we’re monitoring deviations in percent change from the average, we want to ensure the control limits are based on the percent changes instead of raw totals. The upper and lower control limits are set to (+/-) 3 standard deviations.
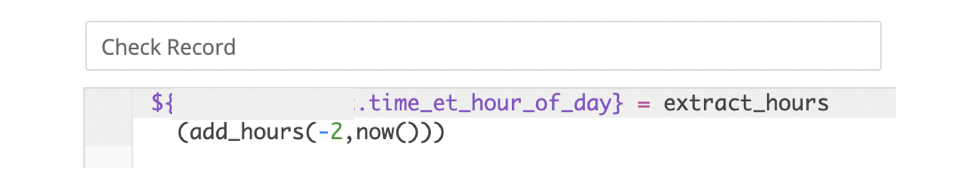
Moving alert window
As noted earlier, the alert should move throughout the day to the most recent complete hour. This is accomplished through another table calculation called “Check Record” that yields true on the desired row. A lag of two hours was used for this example.
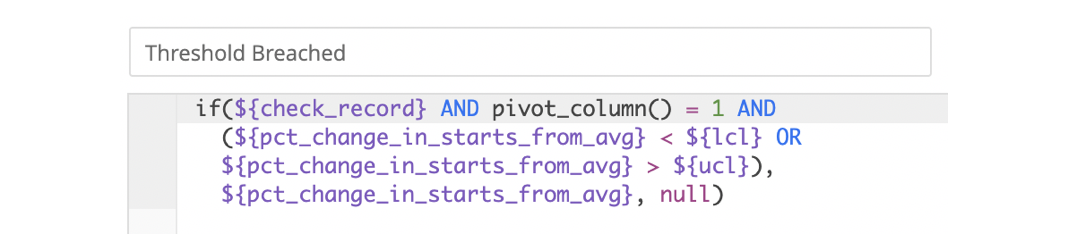
Conditional alerting calculation
The main piece is a table calculation to trigger the alert. This field also needs to be included in the resulting visualization in order for the alerting feature to work. It returns a value only if the row falls within our sliding alert window and the deviation falls outside the control limits.
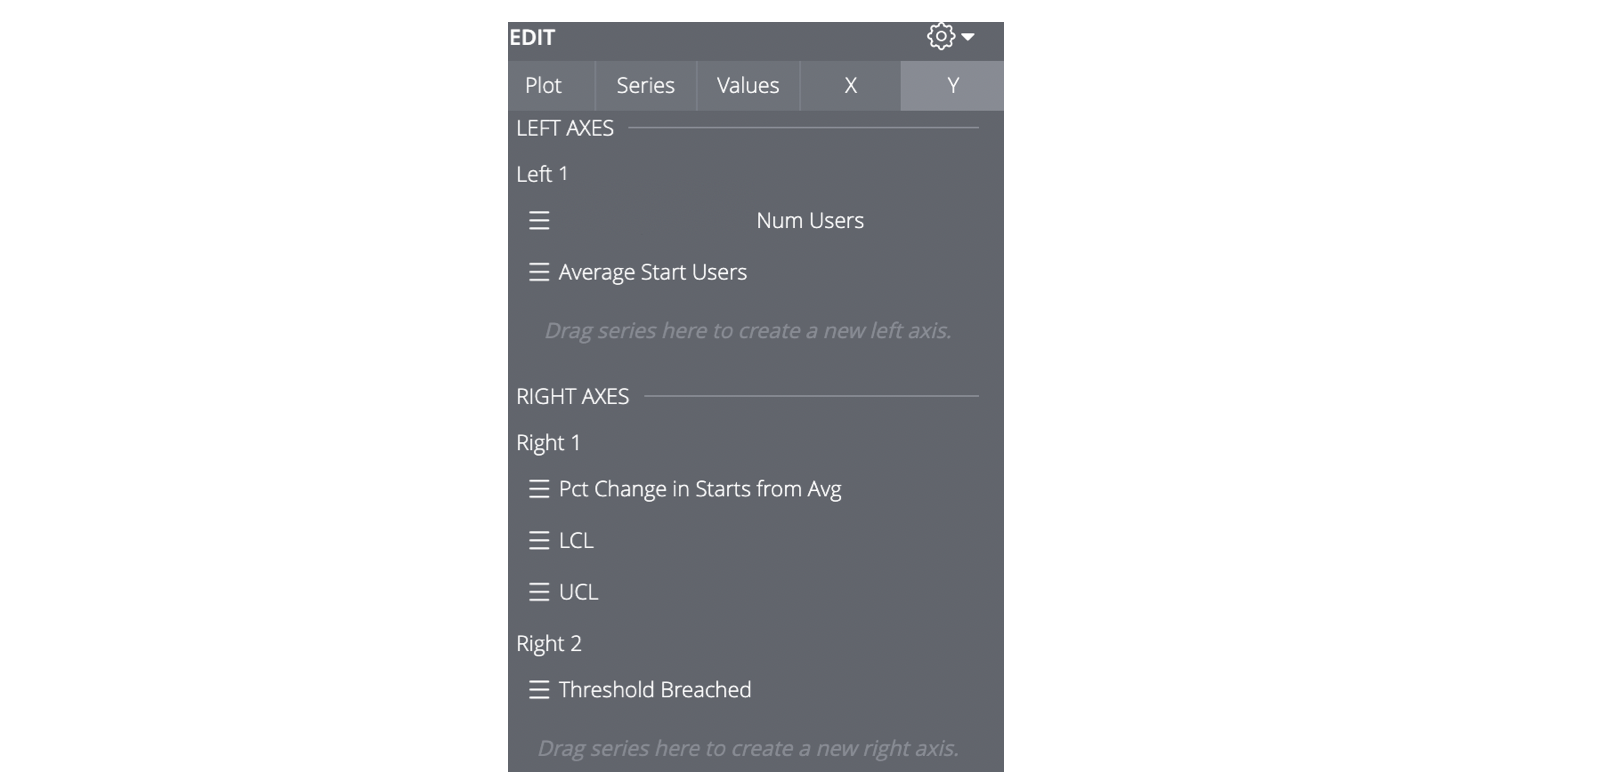
Configure chart axes
Variables in the alerting feature use axis names instead of field names . The calculated field that signals alerts should be moved to its own axes. Edit the chart and move each series to either the left or right axis like below (take note of the earlier screenshots of the upper left and lower right hand sides of the results to see which dimensions are hidden from visualization).
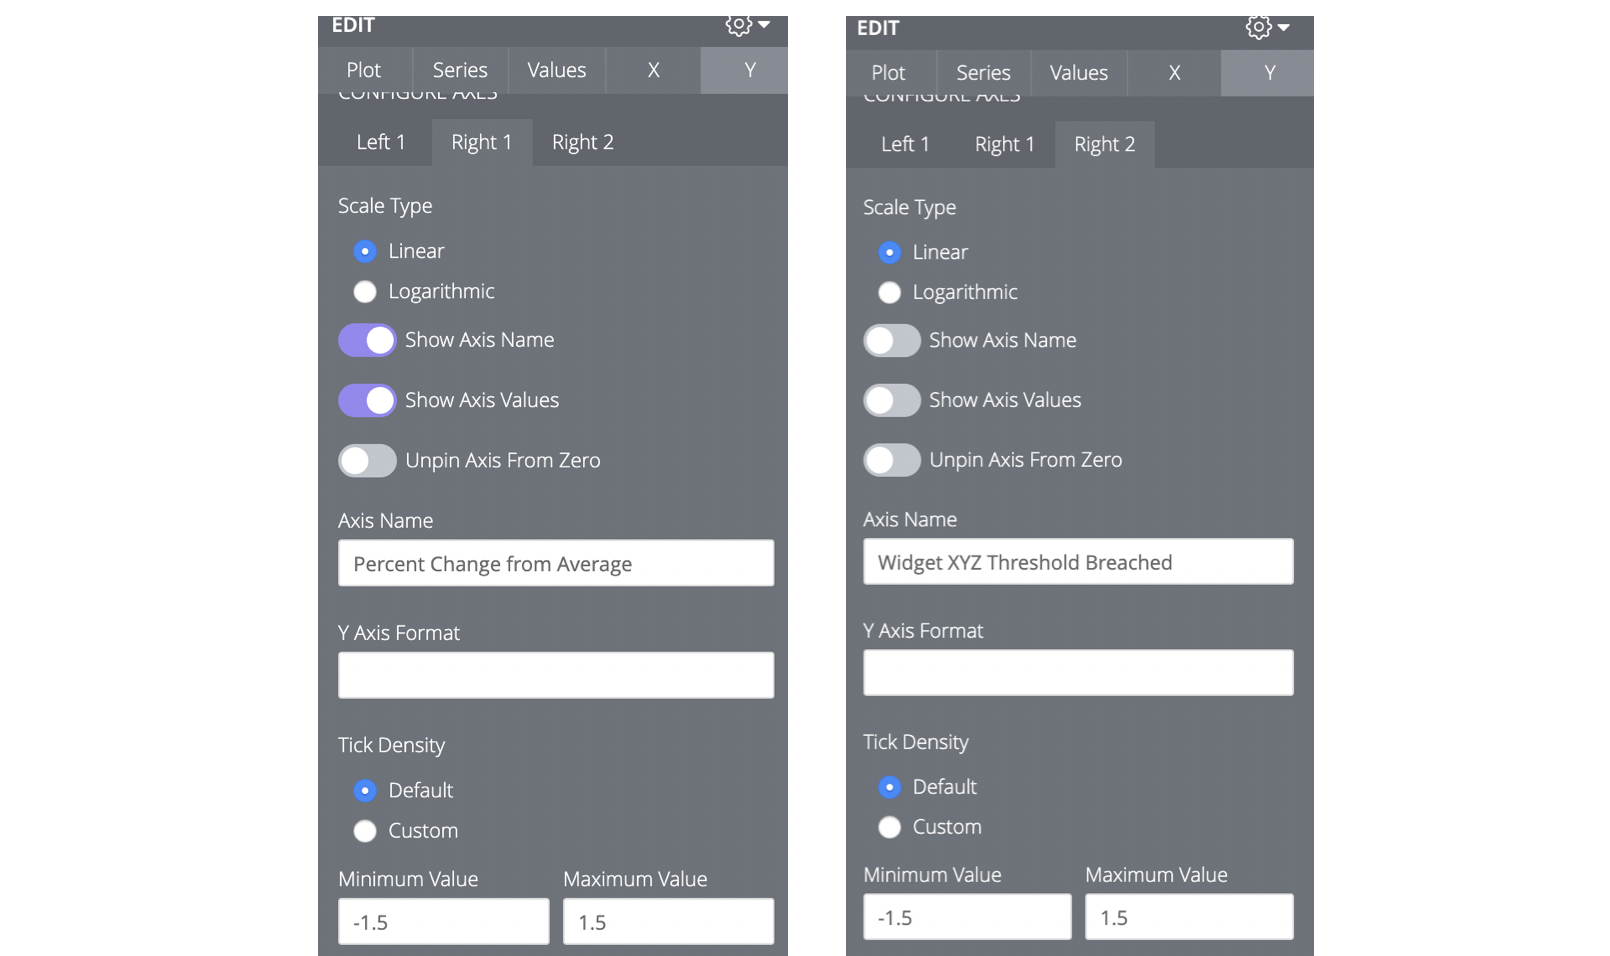
We can also keep the axis bounds consistent (in this case [-1.5,1.5]) and give the axis an informative name. Just keep in mind if the alerting data point falls outside these bounds, which is excluded from the visualization, it will fail to trigger an alert.
Line->bar conversion; hide each historical series
There are a ton of dimensions to clean up in the visualization. First, make sure the line chart option is selected. Next, unhide the legend so that you can hide the historical series by toggling each one. Hide the legend once the appropriate series are hidden.
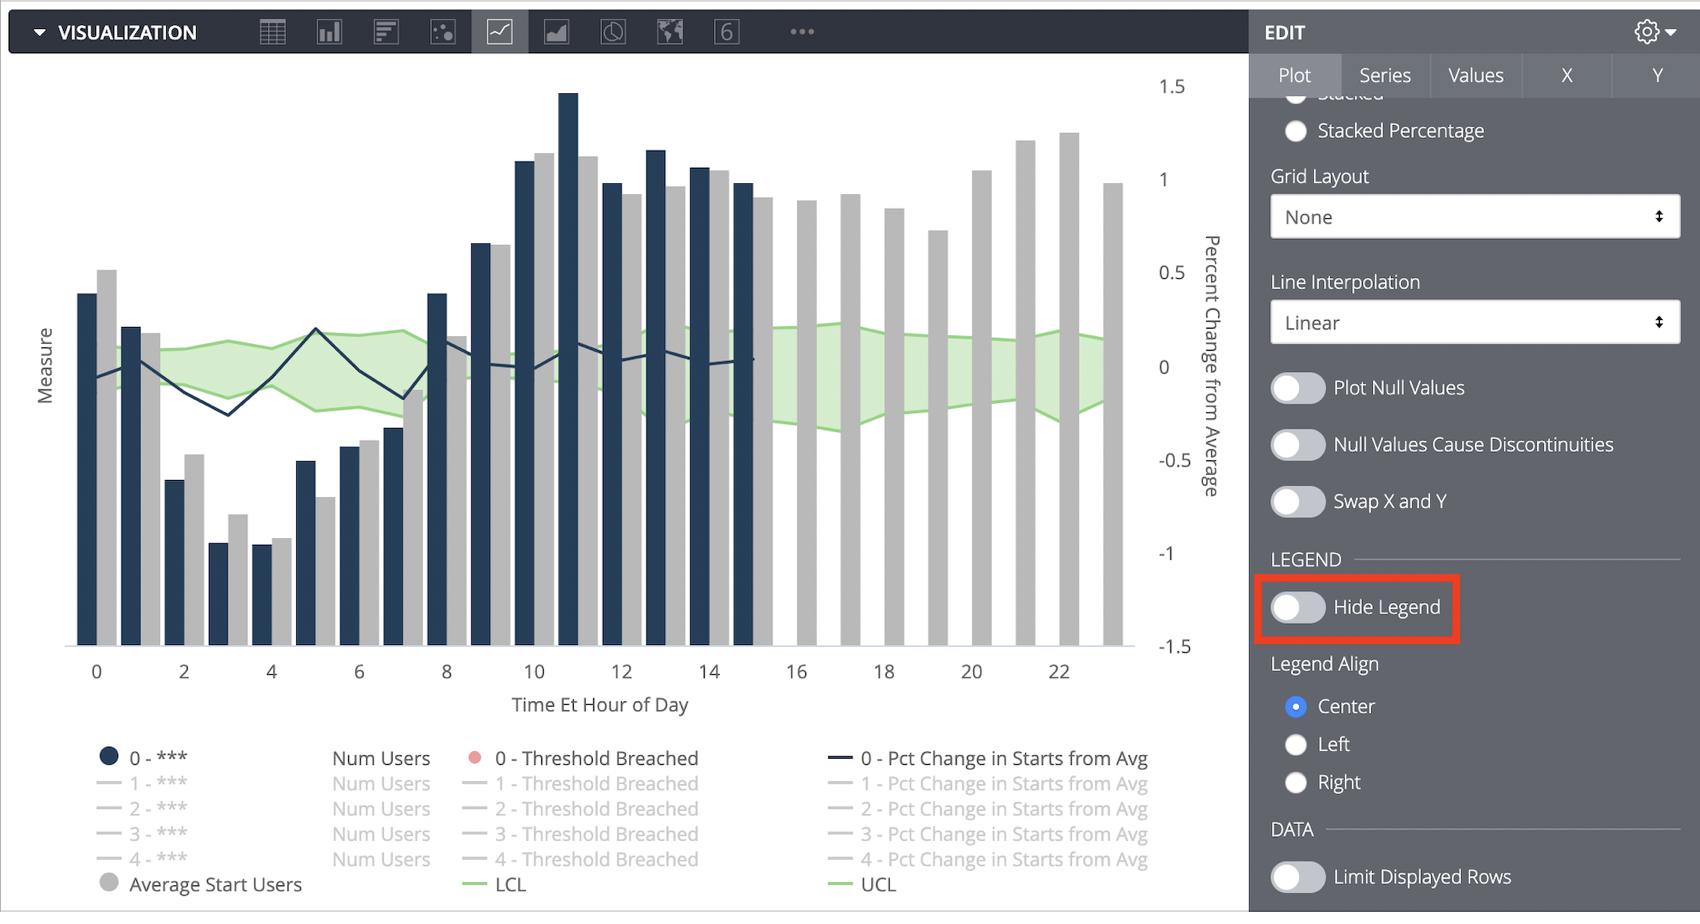
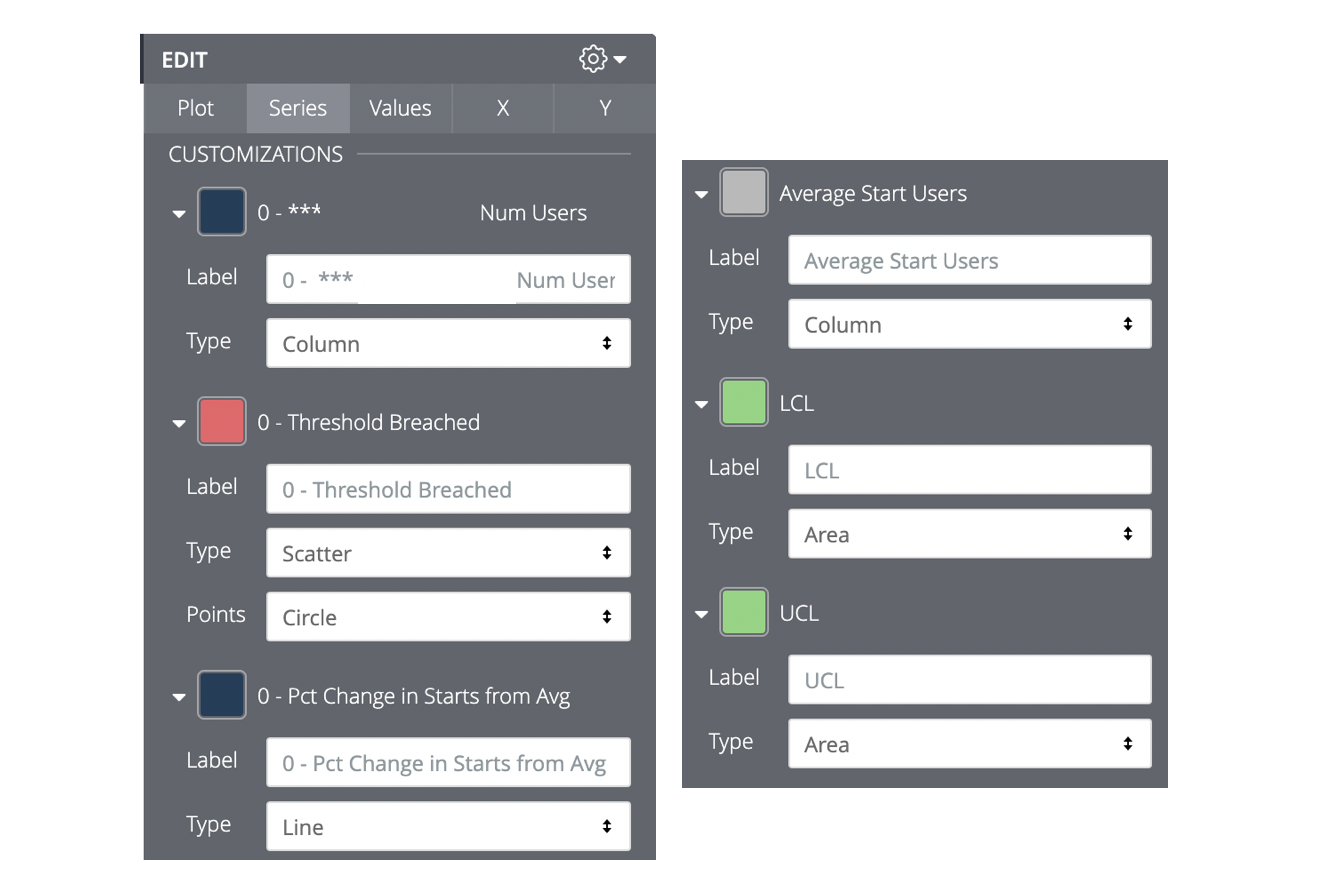
And finally, adjust the remaining displayed dimensions to the visualization types you fancy.
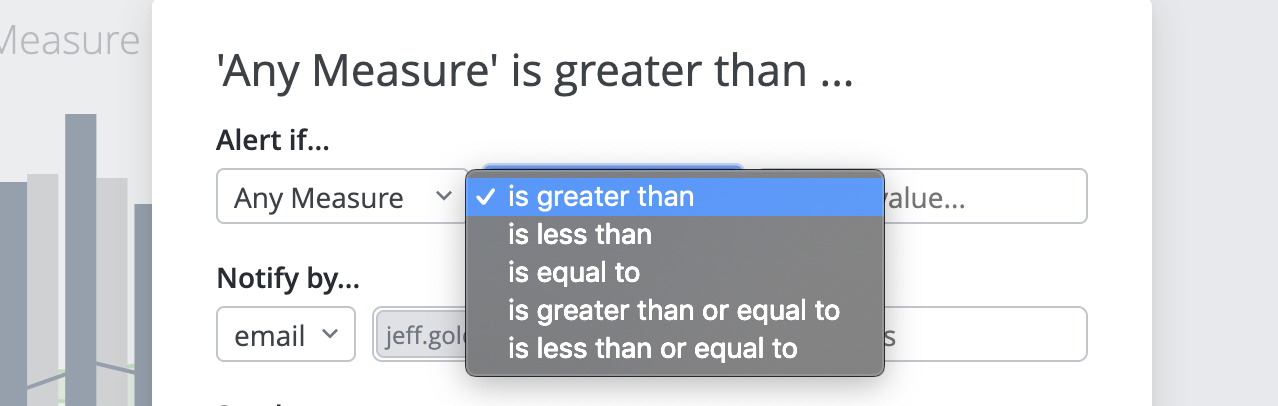
Add the alert
The available “Alert if…” options only allow for static threshold values, such as “less than 20%”. However, we want our alert threshold to change dynamically just like the green region in the chart.
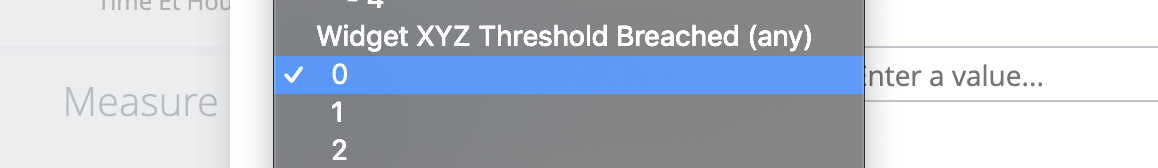
To get around this, we introduced the conditional table calculation that returns either a null or deviation value whenever an alert should be raised. Add an alert for the (hidden) axis name “Widget XYZ Threshold Breached” on the 0 column. The 0 column corresponds to the current day’s data.
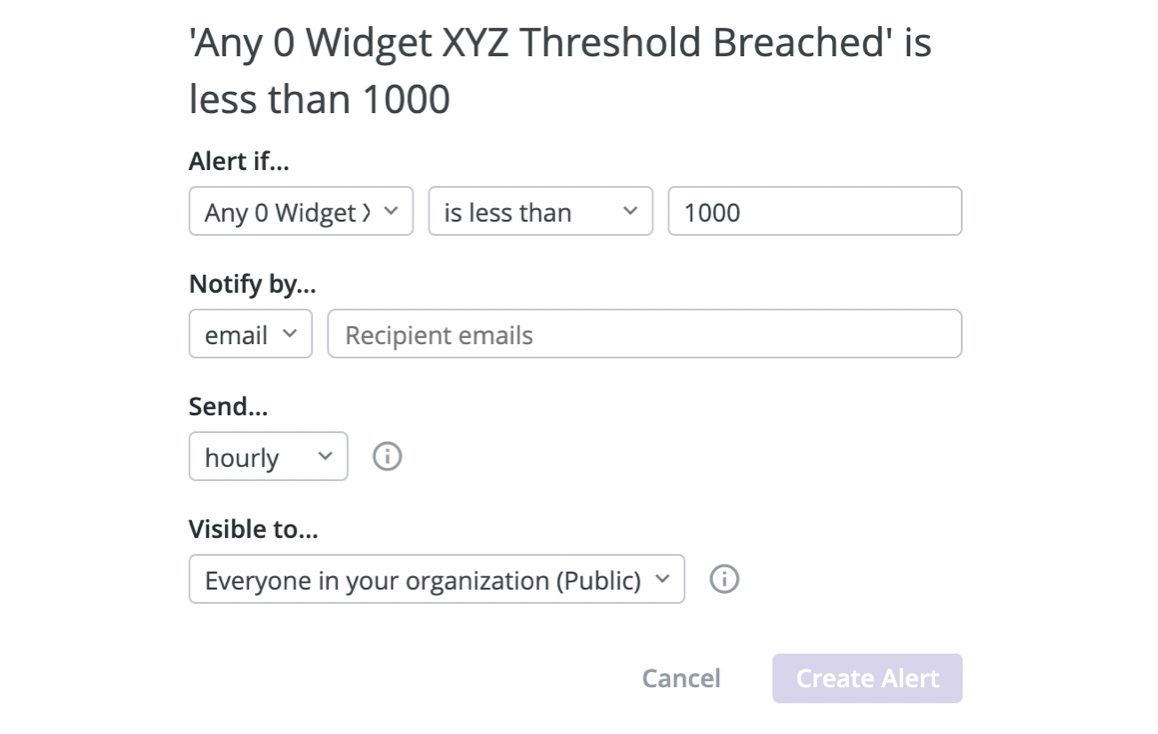
Recall that our only dimension on this axis is the “Threshold Breached” calculation that only returns the percentage deviation if the threshold is breached, otherwise it is null. Therefore, we can add an alert to notify us whenever this event occurs on an hourly basis by making an “‘Any 0 Widget XYZ Threshold Breached is less than 1000” alert since any acceptable deviations yield null values.
Troubleshooting your alert
It’s important to test new alerts and any changes made to them to ensure they’re working properly in “Alert History”. To do so, set it to run hourly, grab a coffee, and patiently await the clock to strike a new hour (since there is not yet a “test” button).
Also pay close attention to everything in Looker’s alerting documentation. In particular, they note that:
Each alert captures the dashboard settings at the time the alert was created. Your alert will not pick up any changes made to dashboard filters or the appearance of your dashboard tile’s visualizations (such as changing the visualization type) after you create the alert. You would need to create a new alert after these changes are implemented for them to apply to your alert and email notification.
Whenever you make any change to the underlying tile, it is best practice to recreate any pre-existing alerts on top of it.
Administrative Sidenote
A new permission set named Alerting is available to Admin roles by default. We created an Alerting User role for any non-admin users who need to access the feature.
Key Implementation Details
- Alerts are based on axis names in the visualization, not field names.
- Alerts only work on data in the visualization. You can’t set an alert on an underlying field that you hid from visualization. Suppress any false-positives in the visualization with a conditional calculation, and move this alerting calculation to a hidden axis of its own.
- Using lagged time dimensions simplifies the maintenance of the visualization by keeping column names constant.
- Interactions between multiple variables can not be directly alerted, but a conditional table calculation can be added to capture the interactions and trigger an alert.
- Since there are not yet any string-matching or null-based alerting conditions, set the calculation to only return a number when an alert should be triggered. Then you can set the alert’s static threshold to an arbitrarily large or small number.
- The new alerting feature is based on the visualized data set, which offers an extra layer of customization opportunities as opposed to the original “Scheduled Look” reports. One such example is how the chart in this article used historical data in the result-set to derive dynamic thresholds for the current day’s data.
10
2
4,407
Topic Labels
- Labels:
-
alert
-
visualizations
2 REPLIES 2
Post Options
- Mark as New
- Bookmark
- Subscribe
- Mute
- Subscribe to RSS Feed
- Permalink
- Report Inappropriate Content
Reply posted on
--/--/---- --:-- AM
Post Options
- Mark as New
- Bookmark
- Subscribe
- Mute
- Subscribe to RSS Feed
- Permalink
- Report Inappropriate Content
This is really informative and helpful -- thanks.
Post Options
- Mark as New
- Bookmark
- Subscribe
- Mute
- Subscribe to RSS Feed
- Permalink
- Report Inappropriate Content
Reply posted on
--/--/---- --:-- AM
Post Options
- Mark as New
- Bookmark
- Subscribe
- Mute
- Subscribe to RSS Feed
- Permalink
- Report Inappropriate Content
I’m working in a similar graphs right now. I’m wondering how were you able to fill the area between UCL and LCL?
Top Labels in this Space
-
access grant
4 -
actionhub
9 -
Actions
14 -
Admin
4 -
alert
29 -
Analytics
2 -
Analytics Block
35 -
Analytics General
1 -
API
12 -
bar
10 -
bestpractice
4 -
BigQuery
8 -
blocks
1 -
boards
4 -
Bug
168 -
cache
2 -
case
2 -
chart
17 -
cohort
1 -
connection
5 -
connection database
1 -
content access
1 -
content-validator
2 -
count
6 -
custom dimension
9 -
custom field
19 -
custom measure
8 -
customdimension
9 -
Dashboards
753 -
Data
5 -
Data Sources
4 -
data tab
4 -
Database
5 -
datagroup
2 -
date-formatting
14 -
dates
18 -
derivedtable
1 -
develop
1 -
development
3 -
dimension
17 -
done
8 -
download
19 -
downloading
9 -
drill-down
1 -
drilling
30 -
dynamic
1 -
embed
10 -
Errors
13 -
etl
1 -
explore
84 -
Explores
134 -
extends
1 -
feature-requests
10 -
filed
3 -
filter
245 -
Filtering
118 -
folders
4 -
formatting
19 -
git
2 -
Google Data Studio
2 -
Google Sheets
2 -
googlesheets
7 -
graph
9 -
group by
6 -
html
12 -
i__looker
1 -
imported project
2 -
Integrations
4 -
javascript
2 -
join
2 -
json
3 -
label
4 -
line chart
17 -
link
5 -
links
3 -
liquid
22 -
Looker
6 -
Looker Studio Pro
47 -
LookerStudio
7 -
lookml
169 -
lookml dashboard
15 -
looks
188 -
manage projects
1 -
map
30 -
map_layer
5 -
Marketplace
4 -
measure
4 -
Memorystore for Memcached
1 -
merge
14 -
model
3 -
modeling
2 -
multiple select
1 -
ndt
1 -
parameter
11 -
pdf
8 -
pdt
8 -
performance
7 -
periodoverperiod
5 -
permission management
1 -
persistence
1 -
pivot
21 -
postgresql
1 -
python
2 -
pythonsdk
2 -
Query
3 -
quickstart
4 -
ReactJS
1 -
redshift
4 -
release
16 -
rendering
8 -
Reporting
10 -
schedule
51 -
schedule delivery
5 -
sdk
1 -
Security
4 -
sharing
2 -
singlevalue
16 -
snowflake
3 -
sql
24 -
SSO
1 -
stacked chart
10 -
system activity
5 -
table chart
16 -
tablecalcs
144 -
Tile
12 -
time
8 -
time zone
3 -
totals
13 -
Training
1 -
Ui
19 -
usage
4 -
user access management
3 -
user management
3 -
user-attributes
6 -
value_format
4 -
view
4 -
Views
4 -
visualizations
558 -
watch
1 -
webhook
2
- « Previous
- Next »